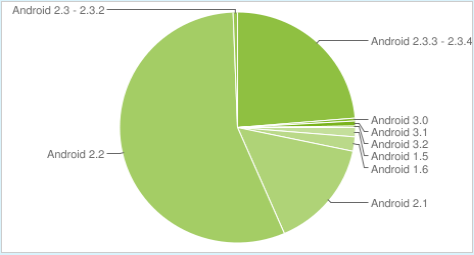
The latest statistics about the Google Android platform have been published. The graph shows the usual rise of the newer versions of the operating system. The largest portion is Android 2.2 which accounts for 55.9% of all devices which is followed by Android 2.3.3/4 with a 23.7% share.

The data continues to be collected every 14 days and is based on devices that connected to the Android Market within that 14 day period. As time goes on, older versions decline and are replaced by newer versions.
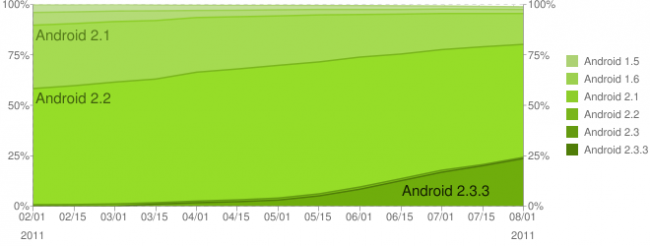
The reasons Google creates the graphs is to allow developers to get a quick glimpse of which versions of Android they should be optimising for, or leaving behind. The graph below shows the timing and the changes over the past few months:

Source


Speak Your Mind
You must be logged in to post a comment.