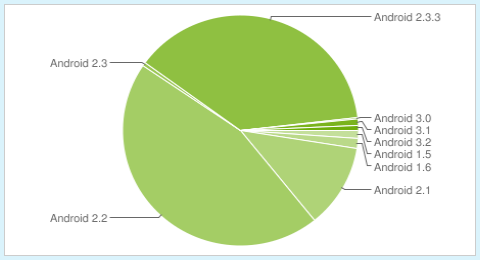
One of the early problems with the Google Android operating system was that the company pushed out a lot of updates quite quickly. This meant that each time a new device came out it often had a new version of an OS installed but that some older devices were stuck on older versions. Google [GOOG] is now slowing down on how often it pushes out updates for Android and since making that change you can now see the older Android 1.X and early 2.x devices slowly getting smaller on the graph. What we see below is the latest update on the percentage of devices that use various versions:

As can be seen in the graph Android 2.3 Gingerbread now accounts for about 39% of all devices. Android 2.2 Froyo is still the leader and has a share of 45.3% with the rest slowly gradually getting smaller. One of the worries is the amount of tablets have been sold with Honeycomb installed. Looking at the chart, Honeycomb installs only account for 1.8% of the whole chart. Even when Amazon launches the Kindle Fire we’re not sure if those units will be included in the count as the Android.com website only tracks devices that visit the Android Market and I don’t think the Kindle Fire uses the Android Market as they opted to use the Amazon variation.
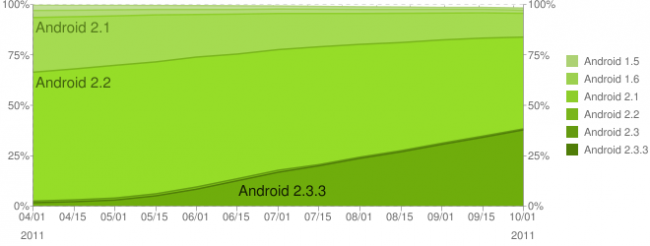
Another view of the data can be found in the chart below:


Speak Your Mind
You must be logged in to post a comment.